Designing Antenna Systems for Maximum Sensitivity
Communications Link Quality
The design of an antenna system involves deciding how much antenna gain is needed and specifying amplifiers and receivers for a specific signal-to-noise ratio. For a given power density, the gain of the antenna determines the power into the receiver. Our job is to choose the antenna gain for acceptable performance. If the antenna gain is too little, then the signal will be noisy. If it is too large, the signal will be distorted due to saturation of the receiver.
When you listen to a radio and the signal is weak you hear noise. This audio noise is caused by electromagnetic noise from the random fluctuation of electrons. Some of this noise comes from outside the antenna system (external noise) and some from inside the receiving system (internal noise). The quality of the received signal depends on the ratio of signal power to noise power, called signal-to-noise ratio, or SNR.
In this tutorial we will learn how to calculate compression points, SNR, sensitivity, and minimum discernible signal levels. This will enable us to predict receiving system performance and ultimately design the system for maximum sensitivity.
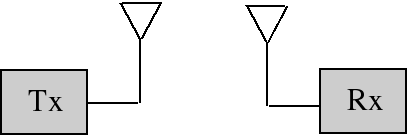
In a communications link, if the signal is too noisy we could increase the transmitter power, the transmit or receive antenna gains, or decrease the noise added by the receive system. In other words, the signal-to-noise ratio out of the receiver can be improved by increasing the signal power at the input to the receiver or by decreasing the noise added by the receive system. First we will learn how to quantify the noise added by the system and then how to calculate the signal-to-noise ratio.
In the diagram above, for a given power density, the gain of the receive antenna determines the signal power into the receiver. We need to choose the receive antenna gain for acceptable performance. If the gain is too little, then the signal will be noisy. If it is too large, the signal will be distorted due to saturation of the receiver.
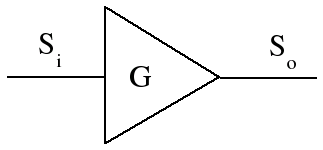
Definition: Amplifier gain is the ratio of the component's or system's signal output power to its signal input power.
G[dB] = 10log(So / Si) = So[dBm] - Si[dBm]
Compression Point
The 1dB compression point tells us the largest signal the receiver, amplifier, or system can handle without significant distortion. The 1 dB compression point refers to the input or output that results in 1dB of gain compression. This compression causes saturation distortion.
Example: An amplifier, whose input and output power are shown in the diagram below, normally has 30 dB of gain. When it is at the 1 dB compression point it only has 29 dB of gain and its output is distorted.
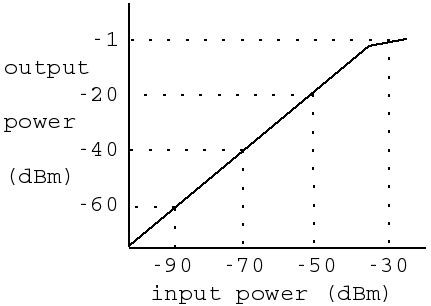
The compression point can be referenced to the input or the output. For receivers or systems, the maximum output is usually specified. The variables CPi and CPo will be used to refer to input and output referenced compression points, respectively. In the previous example
CPi = -30 dBm
CPo = -1 dBm
Example: What is the input compression point for this amplifier?
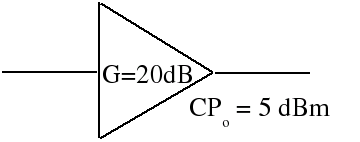
Solution: 19 dB is the amplifier gain when it is in 1 dB of gain compression and therefore
CPi = CPo[dBm] - 19dB = -14dBm
An antenna system has a receiver, transmission line, and usually one or more amplifiers. The receiver and amplifiers all have their separate compression points. Only the compression point of one of the components will end up being the determining factor for the compression point of the system.
Example: What is the system 1 dB compression point (referenced to the input) for the antenna system shown below?
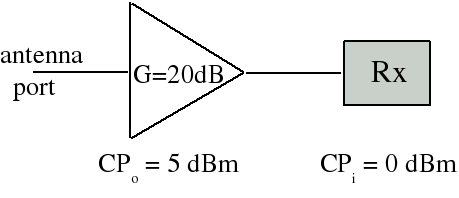
Solution: In this case, as the power level into the system is increased the first component to go into compression is the receiver. The input, when the receiver is at its 1 dB compression point, is
Pi = 0dBm - 20dB = -20dBm
Therefore the system compression point (referenced to its input) is -20 dBm.
Example: What is the system 1 dB compression point (referenced to the input) for the antenna system shown below?
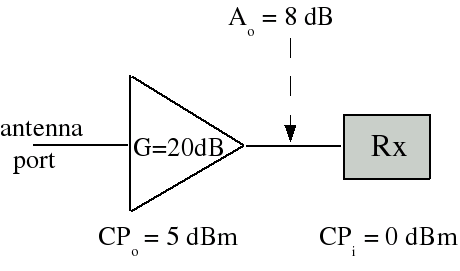
Solution: This time the transmission line has 8 dB of attenuation. We need to determine which component saturates first, the amplifier or the receiver. When the amplifier output is at its compression point of 5 dBm, the receiver input is 8 dB less, or -3 dBm. So the preamp compresses before the receiver and the system 1 dB compression point (referenced to the input) is
CPi = 5dBm - 19dB = -14dBm
Noise Figure
We first studied compression points in order to determine the maximum signal that a receiving system can handle. Next we examine noise in order to understand the minimum signal power that a system can detect. The noise produced by something is generally proportional to its absolute temperature. Absolute temperature is measured in units of Kelvin. Converting between Kelvin, Celsius, and Fahrenheit is through the following formulas:
oK = 273 + oC
oC = (oF - 32)(5 / 9)
The noise delivered from a resistor to a matched load is equal to:
Ni = kTB
where Ni is in watts, T is the temperature of the resistor in Kelvin, B is the bandwidth in Hertz, and k=1.38x10⁻²³ is Boltzman's constant.
Exercise: What is the noise power delivered to this receiver?
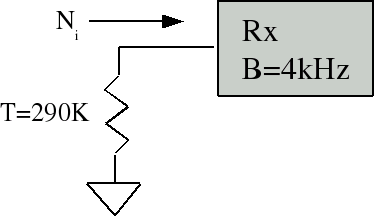
Definition: The noise temperature of an antenna is the temperature Ta, such that the noise coming out of the terminals of the antenna is kTaB. The antenna noise temperature is a function of the temperature of the matter in the direction the antenna is pointed in, its antenna pattern, the frequency, and the radiation efficiency of the antenna.
At microwave frequencies, for antennas whose takeoff angle is approximately zero degrees elevation, the half of the antenna's field of view includes the earth and the other half the sky. The temperature of the earth is about 290 Kelvin, but it only occupies half of the beamwidth. The result is that the antenna noise temperature Ta is approximately 150K. Earth station antennas see lower temperatures because they look up into the cold sky. HF antennas have a high antenna noise temperature due to HF atmospheric noise generated mostly by lightning storms around the world.
Definition: The noise figure is a way of describing the amount of noise generated in a receiver, amp, transmission line, antenna system, or other component. The noise figure of a component or system is defined as the signal-to-noise ratio at the input divided by the signal-to-noise ratio at the output, with the input noise equal to the noise available from a matched resistance at a temperature of T0=290 Kelvin.
F = (Si / Ni)/(So / No) where Ni = kT0B
F[dB] = 10logF
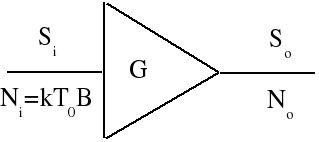
The term noise factor is often used to describe the linear form of noise figure. In other words the ratio of input to output SNR is described as the noise factor and noise figure is the noise factor measured in dB.
The higher the noise figure (or noise temperature) of a component or system, the more noise it adds to the signal. For this reason, it is desirable to have low noise figure (or noise temperature) components and systems. Noise figures (or noise temperatures) of receivers and amplifiers are specified in manufacturers' datasheets. Noise figures can also be measured with a noise figure meter. A component generates noise internally, which degrades the SNR of the signal passing through it by adding noise to the signal. A component can be modeled as a noise-free amplifier of gain G, with noise added to the signal in a summing junction preceding the perfect amp, as shown below.
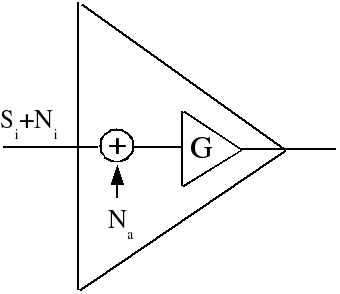
Noise temperature is related to noise figure as follows:
F[dB] = 10log(1 + T/T0)
T = (F - 1)T0
System Sensitivity
Definition: The minimum discernible signal (MDS) is the input that gives an output signal-to-noise ratio of 0 dB (where the signal power is equal to the noise power).
MDS[watts] = kT0BF
where F is the noise figure of the component or system. In dB this is
MDS[dB] = 10log(kT0) + 10logB + F[dB]
MDS[dBm] = -174 + 10logB + F[dB]
Alternatively, in terms of noise temperature
MDS[watts] = kTB
where T is the noise temperature of the component or system in Kelvin. In dB this would be
MDS[dBm] = -199 + 10logT + 10logB
Definition: The sensitivity is the smallest signal we can put in to get a specified minimum SNR out of the system or component. The noise generated inside the system or component is what limits the sensitivity. The graph below shows the response of a receiver whose sensitivity (for 10 dB SNR) is -90 dBm.
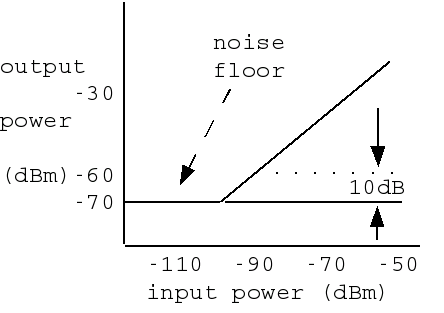
The broader the bandwidth of the receiver, the more noise it passes to its output, so sensitivity is bandwidth-dependent. The relationship between sensitivity and noise figure is
Seinsitivity[dBm] = MDS[dBm] + (S/N)min[dB]
It is usually desirable to operate the receiver at some distance away from the antenna, so a transmission line is needed. This will degrade the sensitivity of the system as a whole. The loss in the transmission line is equivalent to its noise figure and can be lumped in with the receiver noise figure rather than being considered separately:
F[dB] = Ao[dB] + Frx[dB]
This degrades the system sensitivity and increases the antenna gain needed. A preamp will reduce the noise figure of the system if its noise figure is low enough and if the gain is correctly chosen. This will reduce the system sensitivity and allow us to use a lower gain antenna or give us a better SNR using the same antenna.
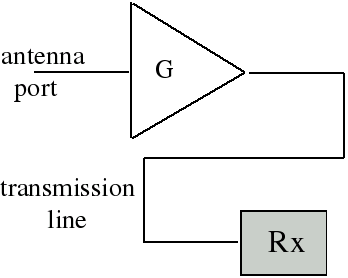
The noise figure of a cascaded system (which includes amps, transmission lines, and the receiver) is a function of the noise figures and gains of the individual components, and can be derived from the noise figure definition to be
Fsys = F1 + (F2-1)/G1 + (F3-1)/(G1G2) +...+ (Fn-1)/(G1G2...Gn-1)
where F1 and G1 are the (linear) noise figure and gain of the first component (the one furthest from the receiver) and the nth component is the receiver.
Example: What is the noise figure (in dB) of the following system?
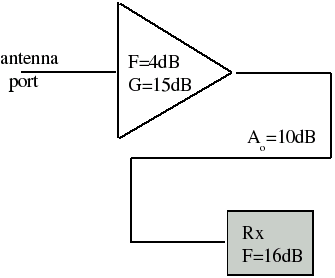
Solution: First we convert all of the noise figures and gains into linear values.
F1 = 104/10 = 2.51
G1 = 1015/10 = 31.6
F2[dB] = Ao[dB] + Frx[dB] = 26 dB
F2[dB] = 1026/10 = 398
Fsys = F1 + (F2-1)/G1 = 15.1
Fsys = 11.8 dB
Designing for Maximum Sensitivity
It is apparent from the system noise figure equation that if the gains are large enough, then all terms will be insignificant in comparison with the first term. Therefore the system noise figure will be approximately equal to the noise figure of the first component. Fsys = F1 is approximately correct as long as (F2-1)/G1 << F1 and (F3-1)/(G1G2) << F1 etc. If we ignore the -1 in the numerator and convert the first condition to dB, then it becomes
F2[dB] - G1[dB] << F1[dB]
As a rule of thumb, 10 dB is usually taken as equivalent to "much much greater than," so
G1[dB] = 10 + F2 - F1[dB]
A similar process for the second condition results in
G2[dB] = 10 + F3[dB] - F1[dB] - G1[dB]
The 10 dB factor is called the excess gain of the amplifier. The strategy of choosing amplifier gains large enough to make the system noise figure approximately equal to the noise figure of the preamp (the amplifier closest to the antenna) is called designing for maximum sensitivity. This strategy will allow the system to detect the weakest possible signal.